Filtering is a complex process, and requires some thought and consideration. It’s important that you read around on some literature on filtering to understand what you are doing to your data, and the consequences of inappropriate filtering (particularly see
this paper for a fantastic overview of the issue).
High-pass filtering - the type of filter that allows the higher amplitudes to pass through but cuts out the lower amplitudes - is a really important early step in your pre-processing pipeline. But high-pass filtering can also cause substantial distortions of your data. So why do it?
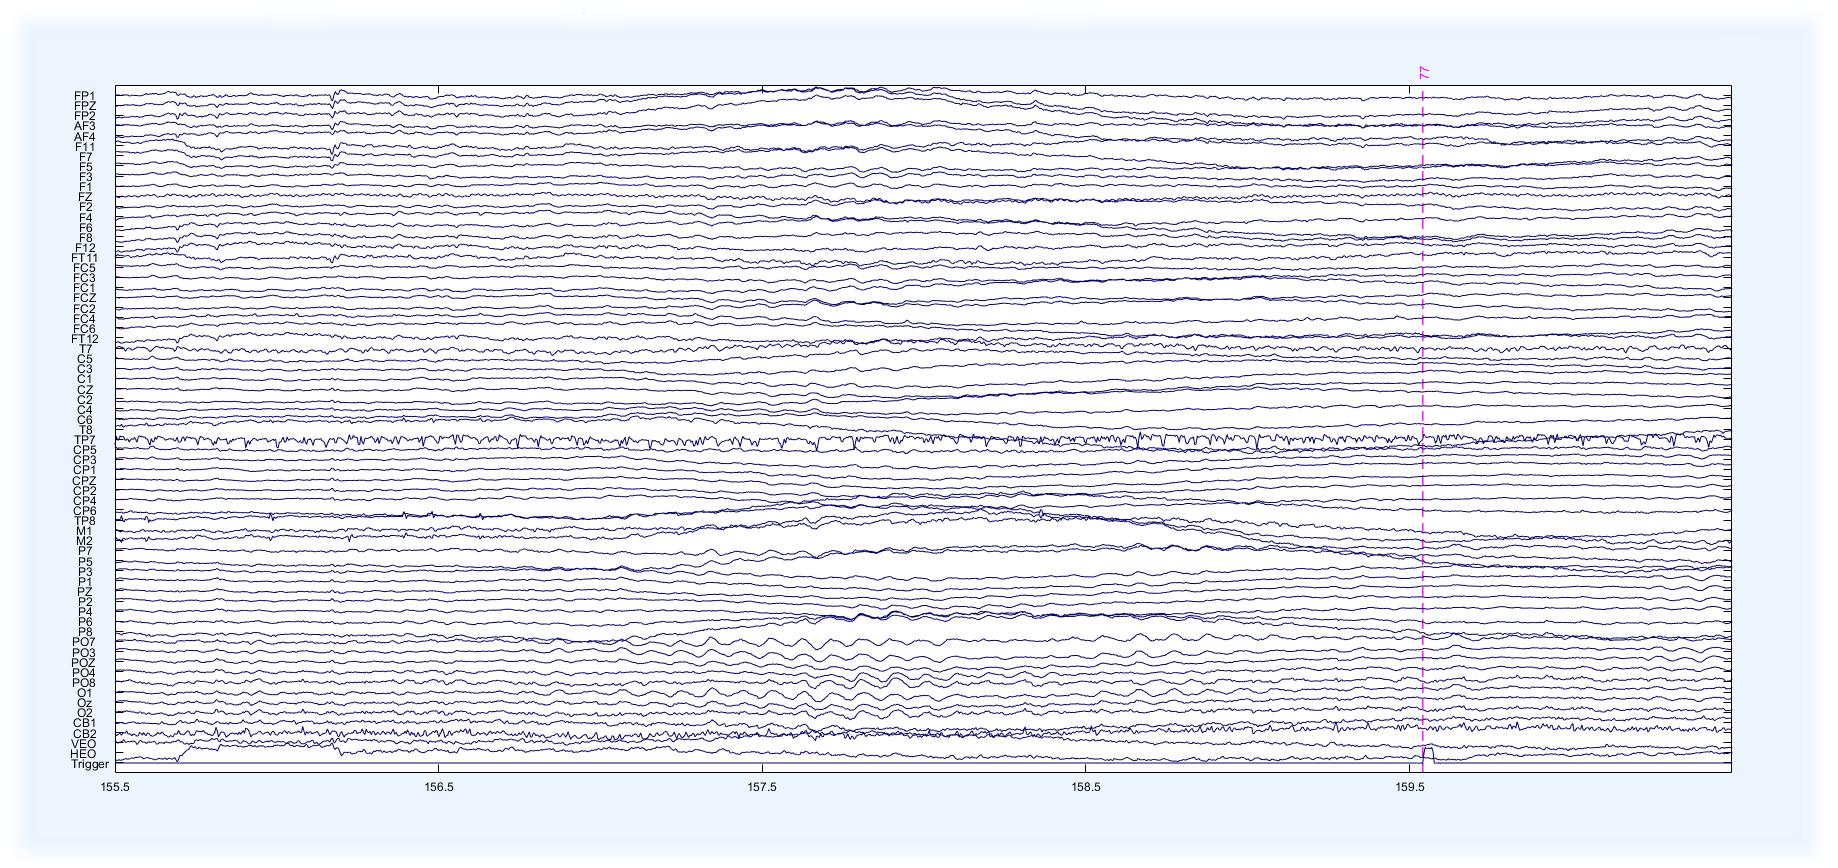
As you record EEG from a participant, you will often notice slow drifts in voltage that occur over time. These can be quite dramatic (as in the picture above) or occur very steadily. These drifts are caused by changes in the conductivity of the skin, which are fairly unavoidable - apart from ensuring your participants don’t sweat excessively (see ‘What if I have really sweaty participants?’ below). High pass filtering predominantly serves to reduce these slow drifts, although will not eliminate them completely.
As with all the other pre-processing steps, you will see plenty of examples in the literature of high-pass filtering done badly. But it is also not to be naive of the fact that all filters will distort your data. Because of this, it’s crucial to select your filter carefully. If you take nothing else away from this tutorial, remember that:
High-pass filtering should always be done on continuous data to avoid edge artifacts (1)
In most instances, a high-pass filter with a 0.1Hz cut-off (half-amplitude) or lower should be used;
Choosing your roll-off slope (2) is equally as important and selecting the right cut-off;
Filtering is almost always underreported. Don’t be an underreporter.
Note that to run this script you should use
Dataset #1 in its original .CNT form, as the script runs from the original continuous files (you need a different function to import .fdt and .set EEGLAB files)
Dataset
To run this operation via the user interface, the example data set (used in the above video) can be downloaded
here
Activity
Have a go at applying the filters both via the UI and with the provided script on Dataset_1. Play around with different filter settings and have a look at what different roll-off and cut-off thresholds do to the data. Finally, save your version of the script to your computer so as to ensure you have an up-to-date script for subsequent tutorial sections (and your own data analysis!).
Write-up
Continuous data was high-pass filtered offline, using an IIR Butterworth filter (2nd order) with a half-amplitude cut-off frequency of 0.1Hz and a and 12 dB/octave roll-off.
(1) High-pass filters use involve computations that require a couple of seconds of data to operate correctly. If you apply the filter to your epoched data, you stand a chance of introducing artifacts at the beginning and end of your epoch
#
(2) When you set a cut-off frequency (e.g., 0.1Hz), the power at this frequency does not immediately drop to 0. Instead, there is a gradual reduction of power over a range of frequencies as specified by the roll-off. Changing this roll-off changes show sharply the filter cuts off power at these frequencies, and higher roll-offs (i.e., 24db/oct, 48db/oct) are sharper in terms of the power cut-off than lower roll-offs (e.g., 12dB/oct). Very sharp roll-offs can cause artifacts, so if you're unsure of what you're doing here, it's safest to 1. go through the recommended reading above, and 2. stick to a softer roll-off (e.g., 12dB/oct).